Performance of my stock vs. cpi
Intro
As a new years resolution, I made a promise to myself to be more conscious about the investments that I’m making. Of the few that I have, I’ve decided to look into the historical performance of one of the funds that I have. I want to compare the stock price increase over time with the overall consumer price for products in the U.S. (using the CPI-U).
Using quantmod to see performance
quantmod is an R package that makes it easy for users to track their stock. I’m going to specifically look into VTSAX which is an index fund managed by vanguard.
library("pacman")
p_load(quantmod, blscrapeR, purrr)
## Installing package into '/home/ck1/R/x86_64-pc-linux-gnu-library/3.6'
## (as 'lib' is unspecified)## also installing the dependencies 'xts', 'zoo', 'TTR'##
## quantmod installed## Installing package into '/home/ck1/R/x86_64-pc-linux-gnu-library/3.6'
## (as 'lib' is unspecified)##
## blscrapeR installedgetSymbols("VTSAX")## 'getSymbols' currently uses auto.assign=TRUE by default, but will
## use auto.assign=FALSE in 0.5-0. You will still be able to use
## 'loadSymbols' to automatically load data. getOption("getSymbols.env")
## and getOption("getSymbols.auto.assign") will still be checked for
## alternate defaults.
##
## This message is shown once per session and may be disabled by setting
## options("getSymbols.warning4.0"=FALSE). See ?getSymbols for details.## [1] "VTSAX"chartSeries(VTSAX, subset="last 11 years")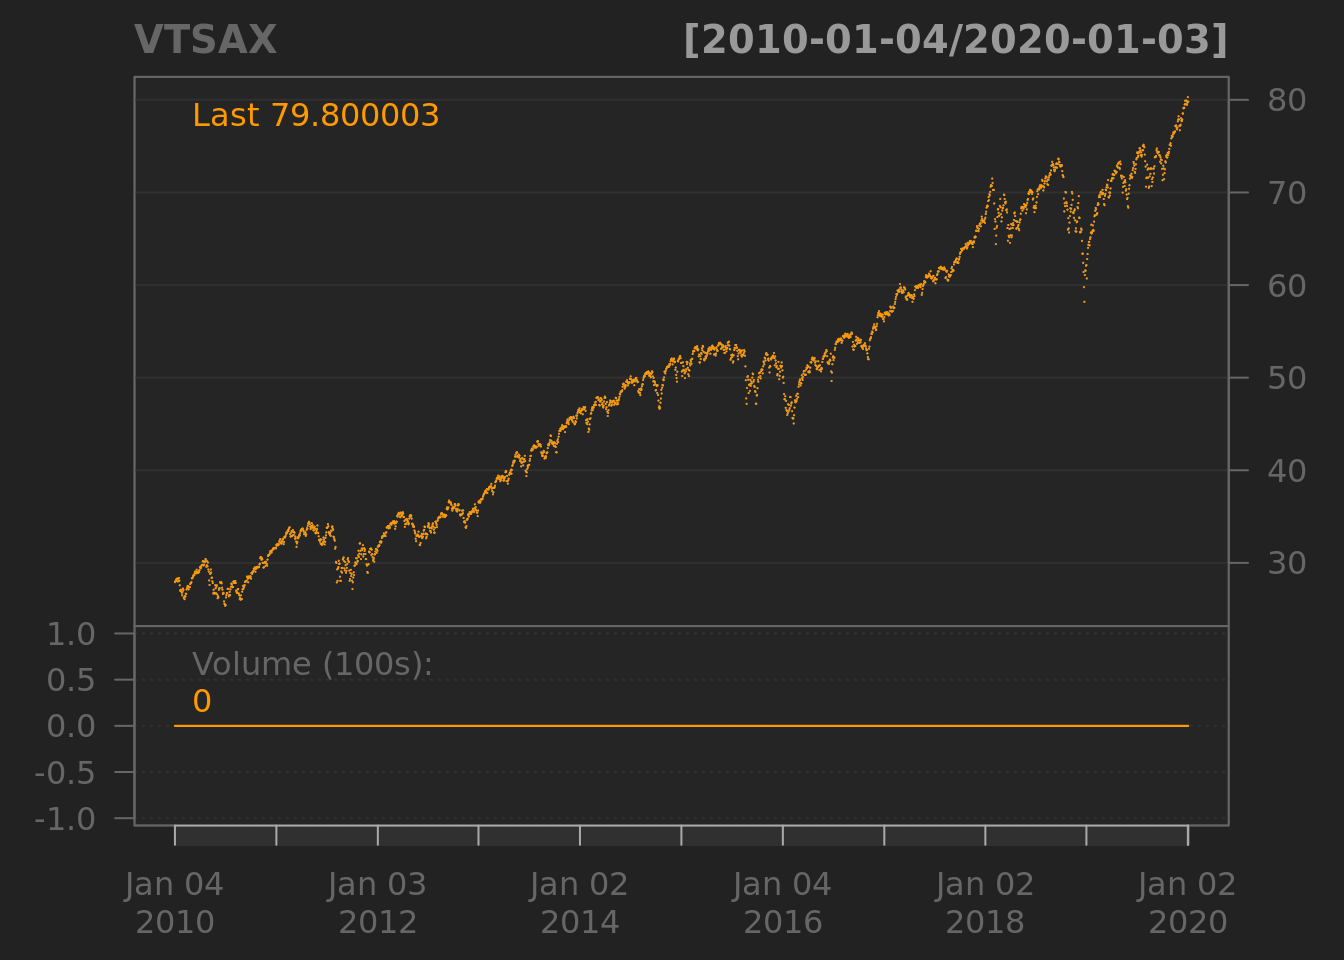
addBBands()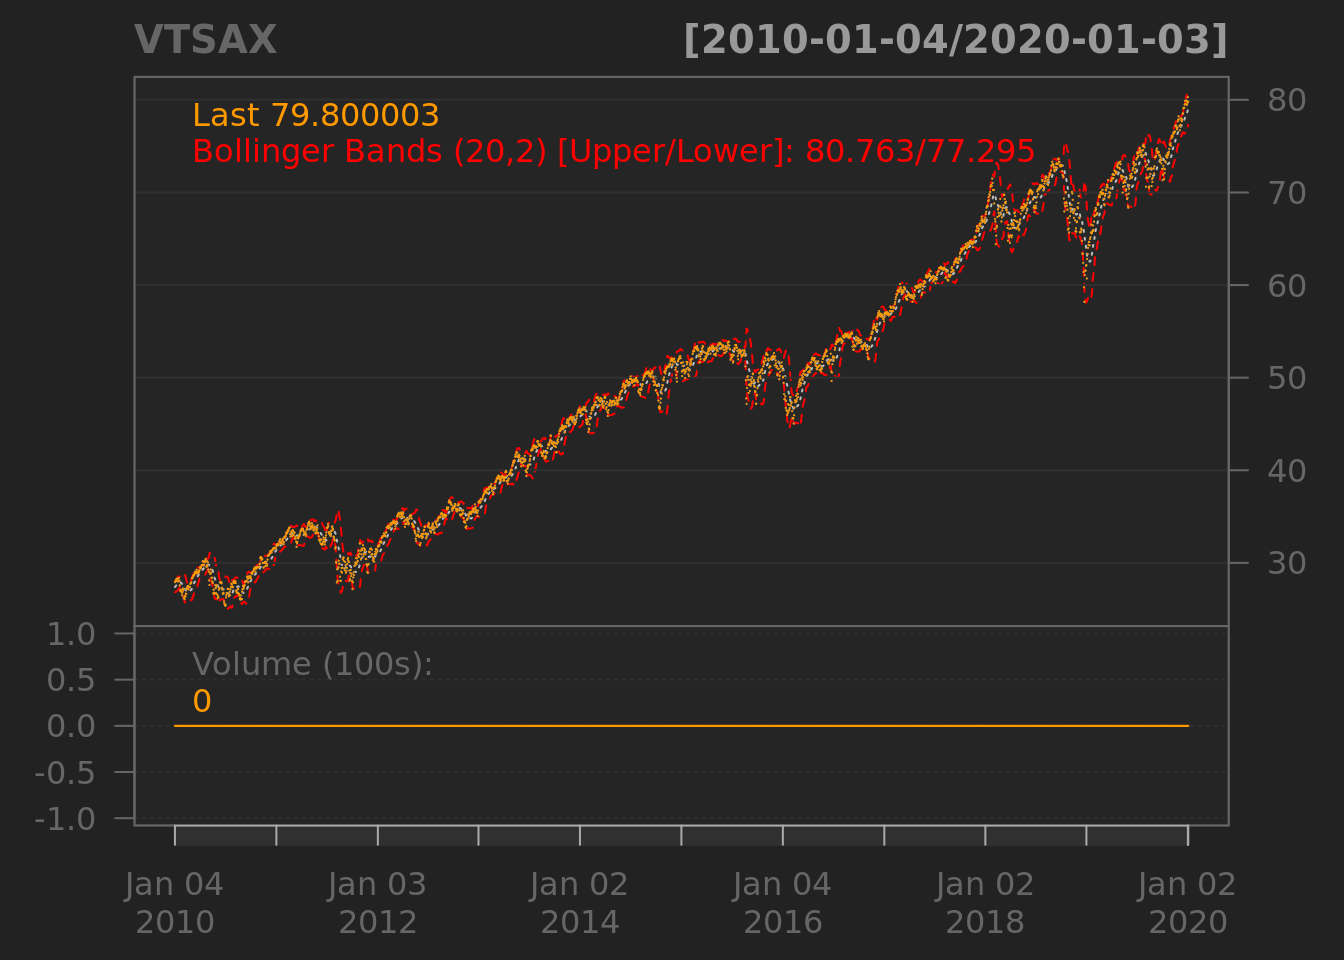
addMACD()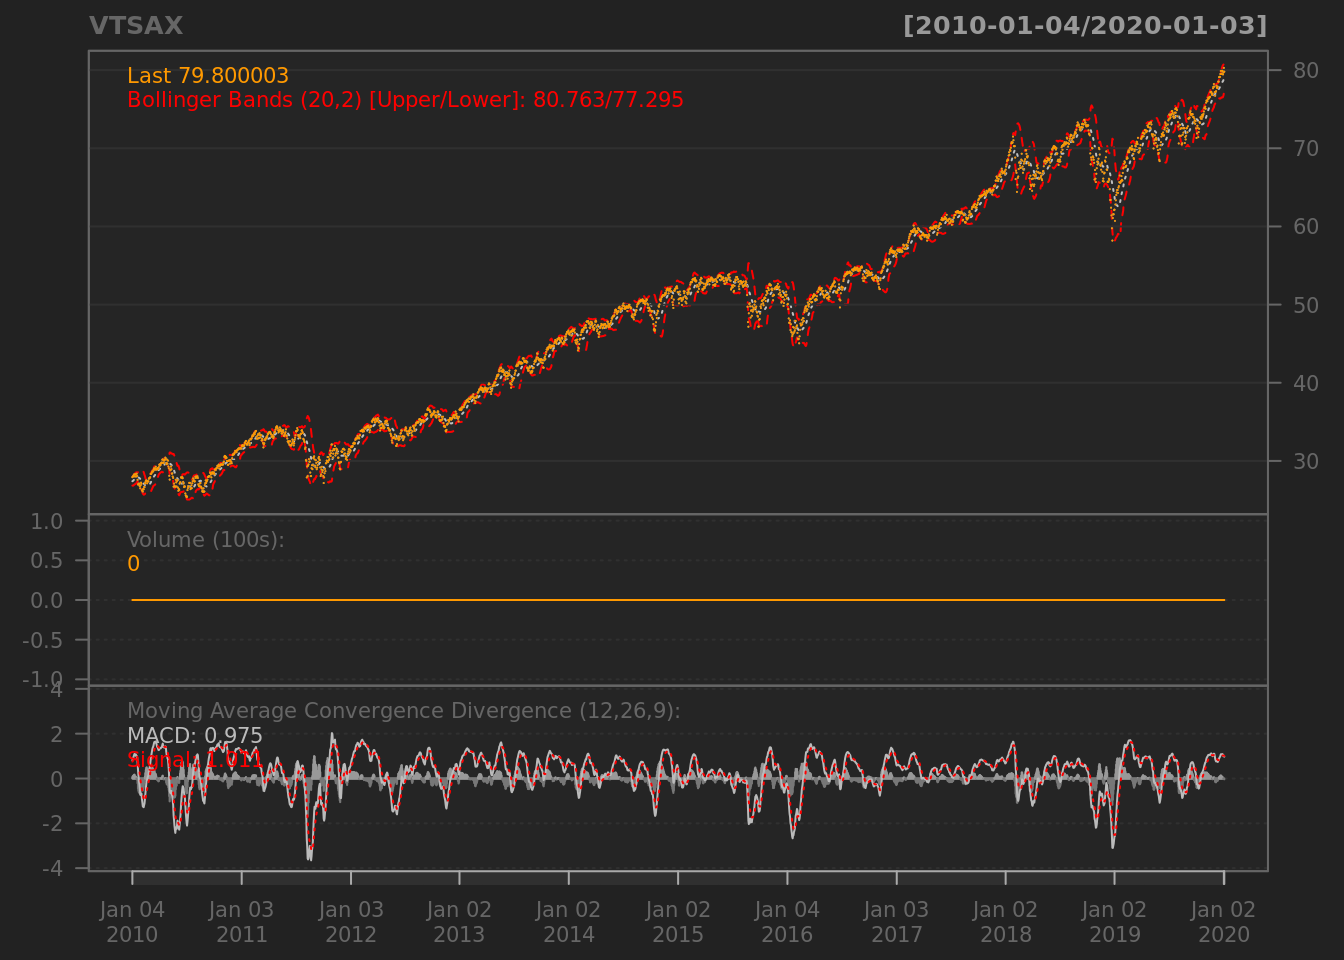
The chart shows the stock price from 2010 to 2020. I’m happy to see that the overall stock is increasing over time (albeit some dips here and there). There are many more features to the quantmod package that allows users to calculate the performance of their stocks (i.e. other measures of trend, volatility, momentum, and volume). I don’t want to complicate this post so I won’t go into the details but feel free to check them out here.
Using blscrapeR to access the BLS CPI API
We’re going to access the Consumer Price Index All Urban Consumers (CPI-U) using the blscrapeR package (data is based on the Bureau of Labor Statistics (BLS) website).
cpidf <- bls_api("CUSR0000SA0", startyear = 2010, endyear = 2019)## REQUEST_SUCCEEDEDhead(cpidf)## # A tibble: 6 x 7
## year period periodName latest value footnotes seriesID
## <dbl> <chr> <chr> <chr> <dbl> <chr> <chr>
## 1 2019 M11 November true 258. "" CUSR0000SA0
## 2 2019 M10 October <NA> 257. "" CUSR0000SA0
## 3 2019 M09 September <NA> 256. "" CUSR0000SA0
## 4 2019 M08 August <NA> 256. "" CUSR0000SA0
## 5 2019 M07 July <NA> 256. "" CUSR0000SA0
## 6 2019 M06 June <NA> 255. "" CUSR0000SA0As described in their website, the CPI is:
The value column is essentially the average prices of good and services in all U.S. cities for that year/month.
Comparing the inflation rates
As indicated earlier, I’m interested in understanding the performance of VTSAX compared to the CPI. I’m really looking to see if the increase in the stock price beats the CPI (and hopefully by a lot).
Below is a few lines of code to create a dataframe that calculates the difference in the price from January of each year from 2010 to 2019. The code also produces a plot to show the difference in the inflation rates over time.
plotdf <- data.frame(yr = seq(2010,2018)) %>%
  pmap_dfr(function(yr){
    # CPI
    base_cpi <- subset(cpidf, year == yr & periodName == "January", select="value")[[1]]
    new_cpi <- subset(cpidf, year == (yr+1) & periodName == "January", select="value")[[1]]

    # Stock
    old_val <- head(VTSAX[paste0(yr,"-01"), "VTSAX.Close"],1)[[1]]
    new_val <- tail(VTSAX[paste0(yr+1,"-01"), "VTSAX.Close"],1)[[1]]

    data.frame(
      StartYr = yr,
      EndYr = yr+1,
      CPI_inflation = ((new_cpi/base_cpi) - 1) * 100,
      Stock_inflation = ((new_val/old_val) - 1) * 100
    )
  })

plot(Stock_inflation ~ EndYr, plotdf, col="blue", type="l", xlab="Year", ylab = "Inflation (%)")
lines(CPI_inflation ~ EndYr, plotdf, col="red")
legend("bottomleft", c("Stock-VTSAX", "CPI"), lty = c(1,1), col = c("blue","red"))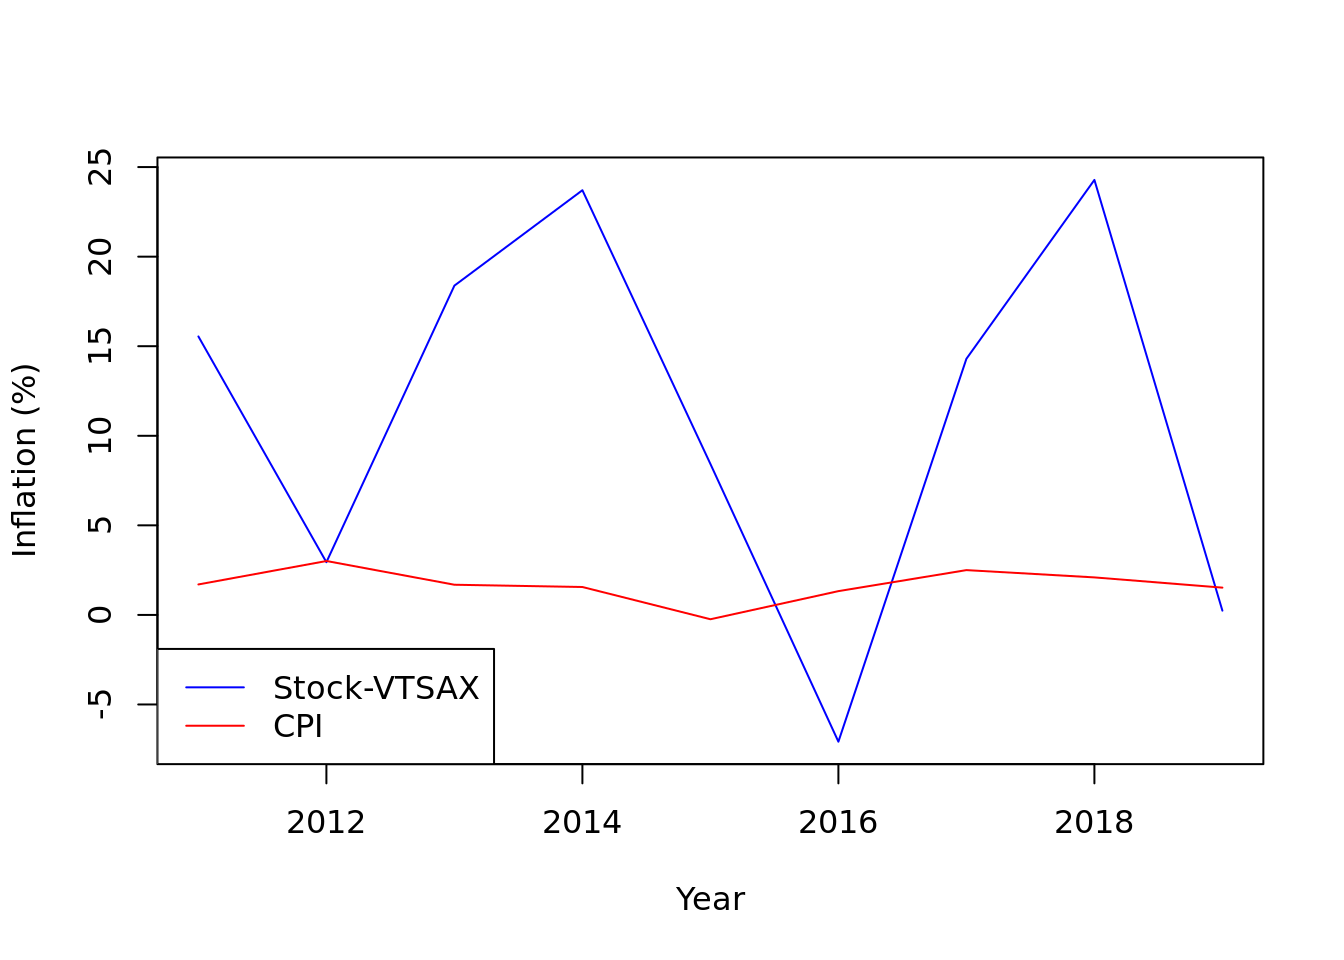
Based on the plot above, I’m quite happy that my stocks are outperforming the CPI almost every year (except for 2016). This practically means that the money that I’m putting into the stock market (compared to storing it in the bank with an account providing < 2 % APR ) is gaining more value even when inflation is continuing over time at a steady rate (inflation means the prices of products and services goes up).
Conclusion
Based on the short analysis above, the stock that I have is outperforming the CPI and the value of my assets are increasing more than the price of products and services sold in the U.S. We could do a more in-depth analysis of the performance of the stock but my philosophy towards trading is to invest based on long-term trends of the market and not to stress out about the minutia.
Again, thanks for reading my blog and I hope you find this post useful!
Chong H. Kim
Health Economics & Outcomes Researcher
My research interests include health economics & outcomes research (HEOR), real-world evidence/observation research, predictive modeling, and spatial statistics.